 Transport Topics Article Rating
NYC Congestion Pricing Gets Quiet Start
- Bias Rating
- Reliability
50% ReliableAverage
- Policy Leaning
-16% Somewhat Left
- Politician Portrayal
-7% Negative
Continue For Free
Create your free account to see the in-depth bias analytics and more.
By creating an account, you agree to our Terms and Privacy Policy, and subscribe to email updates.
Bias Score Analysis
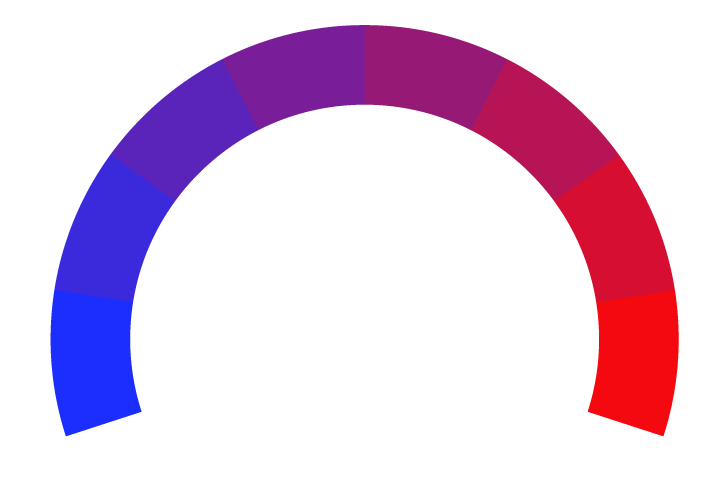
The A.I. bias rating includes policy and politician portrayal leanings based on the author’s tone found in the article using machine learning. Bias scores are on a scale of -100% to 100% with higher negative scores being more liberal and higher positive scores being more conservative, and 0% being neutral.
Sentiments
2% Positive
- Liberal
- Conservative
| Sentence | Sentiment | Bias |
|---|---|---|
Unlock this feature by upgrading to the Pro plan. | ||
Reliability Score Analysis
Policy Leaning Analysis
Politician Portrayal Analysis
Bias Meter
Extremely
Liberal
Very
Liberal
Moderately
Liberal
Somewhat Liberal
Center
Somewhat Conservative
Moderately
Conservative
Very
Conservative
Extremely
Conservative
-100%
Liberal
100%
Conservative

Contributing sentiments towards policy:
57% : About 1.3 million people take public transportation into the district for work compared with 143,000 who drive, according to the MTA.56% : Nick Watkin, a photographer who lives in the Bronx, said he drives into the city about three or four times a week for work, and taking public transportation would double his commuting time.
55% : Discounts for low-income drivers, tax credits for low-income residents of the central business district, and disability exemptions for individuals who are unable to access public transportation will also be available.
29% : Trump may seek a longer environmental review of the program through a legal suit or find a way to stop the tolling through administrative action, according to Brad Lander, New York City's Comptroller.
*Our bias meter rating uses data science including sentiment analysis, machine learning and our proprietary algorithm for determining biases in news articles. Bias scores are on a scale of -100% to 100% with higher negative scores being more liberal and higher positive scores being more conservative, and 0% being neutral. The rating is an independent analysis and is not affiliated nor sponsored by the news source or any other organization.


