Maps: Where Do Federal Employees Work in America?
- Bias Rating
- Reliability
20% ReliableLimited
- Policy Leaning
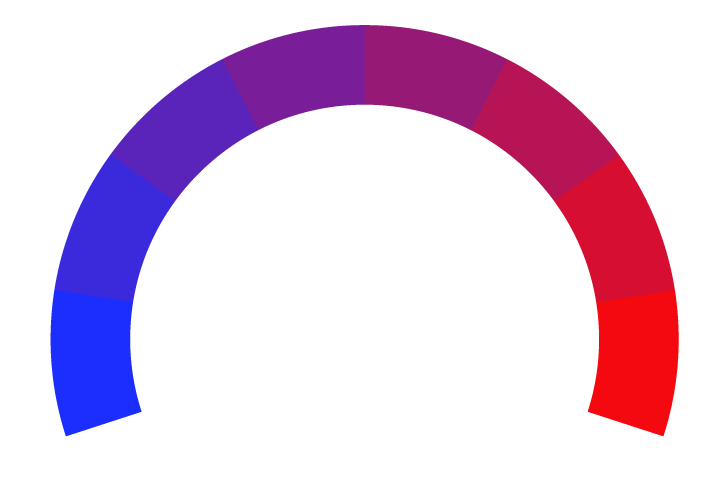
-28% Somewhat Left
- Politician Portrayal
-60% Negative
Continue For Free
Create your free account to see the in-depth bias analytics and more.
By creating an account, you agree to our Terms and Privacy Policy, and subscribe to email updates.
Bias Score Analysis
The A.I. bias rating includes policy and politician portrayal leanings based on the author’s tone found in the article using machine learning. Bias scores are on a scale of -100% to 100% with higher negative scores being more liberal and higher positive scores being more conservative, and 0% being neutral.
Sentiments
-7% Negative
- Liberal
| Sentence | Sentiment | Bias |
|---|---|---|
Unlock this feature by upgrading to the Pro plan. | ||
Reliability Score Analysis
Policy Leaning Analysis
Politician Portrayal Analysis
Bias Meter
Extremely
Liberal
Very
Liberal
Moderately
Liberal
Somewhat Liberal
Center
Somewhat Conservative
Moderately
Conservative
Very
Conservative
Extremely
Conservative
-100%
Liberal
100%
Conservative

Contributing sentiments towards policy:
57% : The National Institute of Standards and Technology's staff of engineers, physicists and chemists is primarily based in Gaithersburg, Md., and Boulder, Colo.55% : Tax examiners and customer service representatives employed by the Internal Revenue Service report to regional offices across the country, including major centers in Memphis; Austin, Texas; and Ogden, Utah.
49% : It does not reveal the specific locations of staff members in many of its more high-profile subagencies like Immigration and Customs Enforcement and Customs and Border Patrol.
48% : They show employees based in every state and in thousands of cities and small towns across the country, far beyond Washington, D.C. The Department of Veterans Affairs -- the largest agency in the federal civilian work force outside of the Department of Defense -- employed more than 480,000 people as of March of last year.
*Our bias meter rating uses data science including sentiment analysis, machine learning and our proprietary algorithm for determining biases in news articles. Bias scores are on a scale of -100% to 100% with higher negative scores being more liberal and higher positive scores being more conservative, and 0% being neutral. The rating is an independent analysis and is not affiliated nor sponsored by the news source or any other organization.


 NY Times