Briggs: Don't blame bad street design for Indianapolis' traffic crisis
- Bias Rating
- Reliability
N/AN/A
- Policy Leaning
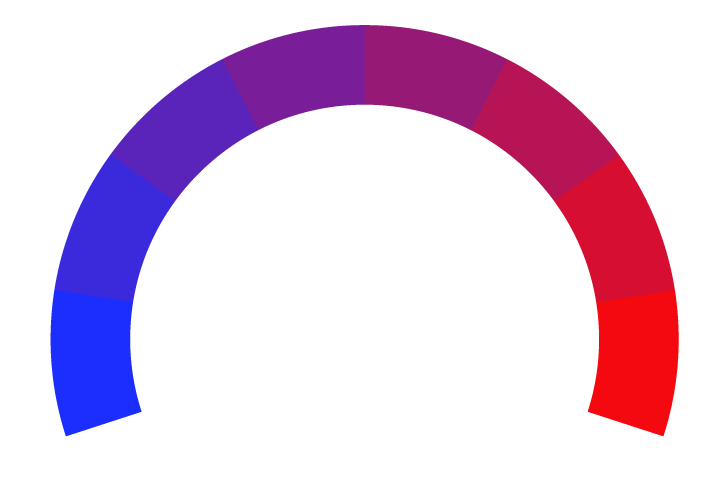
-44% Medium Left
- Politician Portrayal
38% Negative
Continue For Free
Create your free account to see the in-depth bias analytics and more.
By creating an account, you agree to our Terms and Privacy Policy, and subscribe to email updates.
Bias Score Analysis
The A.I. bias rating includes policy and politician portrayal leanings based on the author’s tone found in the article using machine learning. Bias scores are on a scale of -100% to 100% with higher negative scores being more liberal and higher positive scores being more conservative, and 0% being neutral.
Sentiments
N/A
- Liberal
| Sentence | Sentiment | Bias |
|---|---|---|
Unlock this feature by upgrading to the Pro plan. | ||
Reliability Score Analysis
Policy Leaning Analysis
Politician Portrayal Analysis
Bias Meter
Extremely
Liberal
Very
Liberal
Moderately
Liberal
Somewhat Liberal
Center
Somewhat Conservative
Moderately
Conservative
Very
Conservative
Extremely
Conservative
-100%
Liberal
100%
Conservative

Contributing sentiments towards policy:
49% : But, between 2007 and 2017, IMPD recorded an average of 64 fatal collisions per year, a number that had been ticking up in recent years as the department devoted fewer resources to enforcement and issued far fewer citations.48% : Enforcement was especially low last year as IMPD sought to avoid unnecessary public encounters during the COVID-19 pandemic.
44% : In the weeks since a horrific crash killed a 7-year-old girl outside of an elementary school in Irvington, the discussion over traffic has splintered in two directions: street design and enforcement.
43% : The bulk of available evidence suggests that enforcement in general, including through the use of cameras, can make a difference.
43% : IMPD for years pulled back on enforcement because of shrinking resources and philosophical changes.
*Our bias meter rating uses data science including sentiment analysis, machine learning and our proprietary algorithm for determining biases in news articles. Bias scores are on a scale of -100% to 100% with higher negative scores being more liberal and higher positive scores being more conservative, and 0% being neutral. The rating is an independent analysis and is not affiliated nor sponsored by the news source or any other organization.


 Indystar